


We rebuilt VanSky: honest rankings and five years of weather
You are planning to drive to the coast next week, and the forecast says rain on Saturday. VanSky now also shows what the weather has usually been like on those dates over the past five years. The ranking, meanwhile, has stopped counting downpours as sunny days.

It is late October and you are wondering whether to head for the coast next week. The forecast shows rain on Saturday, and you cannot tell whether that is bad news or simply normal here at this time of year. Until now VanSky only gave you the forecast, and, as it turned out, not always a correct one. So we rebuilt the whole section: the formula, the data, the city page and everything we share with other services.

Rainy days counted as dry in the ranking
This was the most unpleasant discovery. ICON, the model behind the forecast, gives no probability of rain, and our code turned the empty value into zero. A day with 30 mm of rain was therefore scored like a clear one. We now estimate the probability from the amount of rain. We checked the curve against the public Open-Meteo forecast for 360 cities, and the error fell from 29 points to 16. Rainy days lost 13 points on average, whole weeks lost 5. If your city has dropped in the ranking, this is usually why: it used to sit higher than it deserved.
We found other bugs along the way. The reference cities of each country ran on Greenwich time, so their days and sunrises were shifted. The “now” score and the “today” score were calculated differently and disagreed by a couple of points. Kazbegi in Georgia showed a forecast frozen in June. Britain and Ireland sometimes had no weather data at all.
What the weather is usually like on these days
This is the feature people had waited for longest. Every city page now has a chart for the whole year: day and night temperatures, an index for each month and stars on the best ones. Move the slider to your date and you see how many of 35 similar days had rain, what the sky is usually like, how warm the sea is and how much power 500 W of solar panels on the roof will produce. Below that are the best time to travel and the warm-sea season.
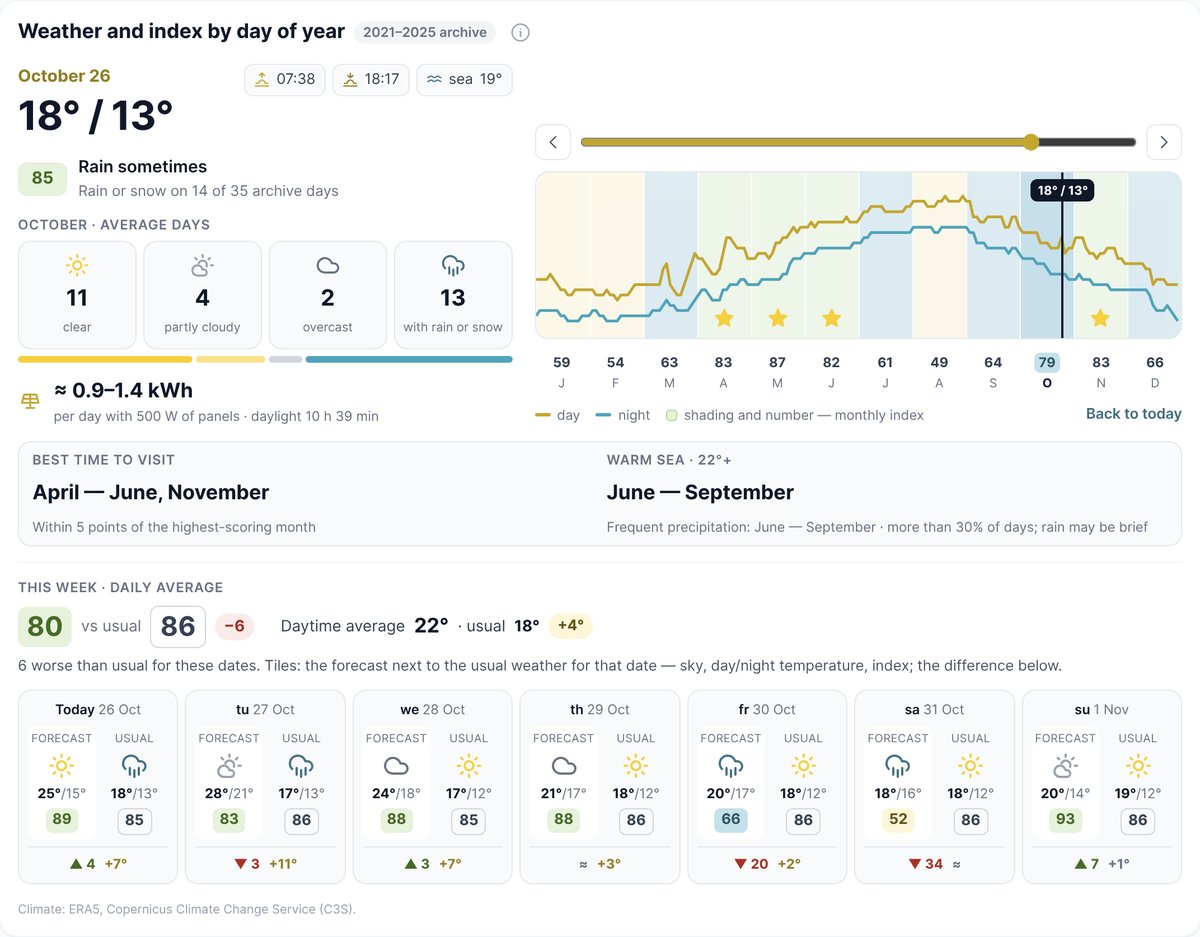
The most useful part is the “This week” row. Each forecast day sits next to the usual weather for the same date. Rain on Saturday stops being simply bad news: in Batumi at the end of October it rains on 14 days out of 35, which is an ordinary autumn. But +28° on Tuesday is 11° warmer than normal.
The city page now fits on one screen
All 44,000 cities in 165 countries have the new design. At the top are today and the week: the score, a bar for each day and a short verdict such as “6 of 7 days comfortable, best stretch Mon–Wed”. Below it is advice in plain language: whether you can leave the awning out overnight and whether you will need the heater.
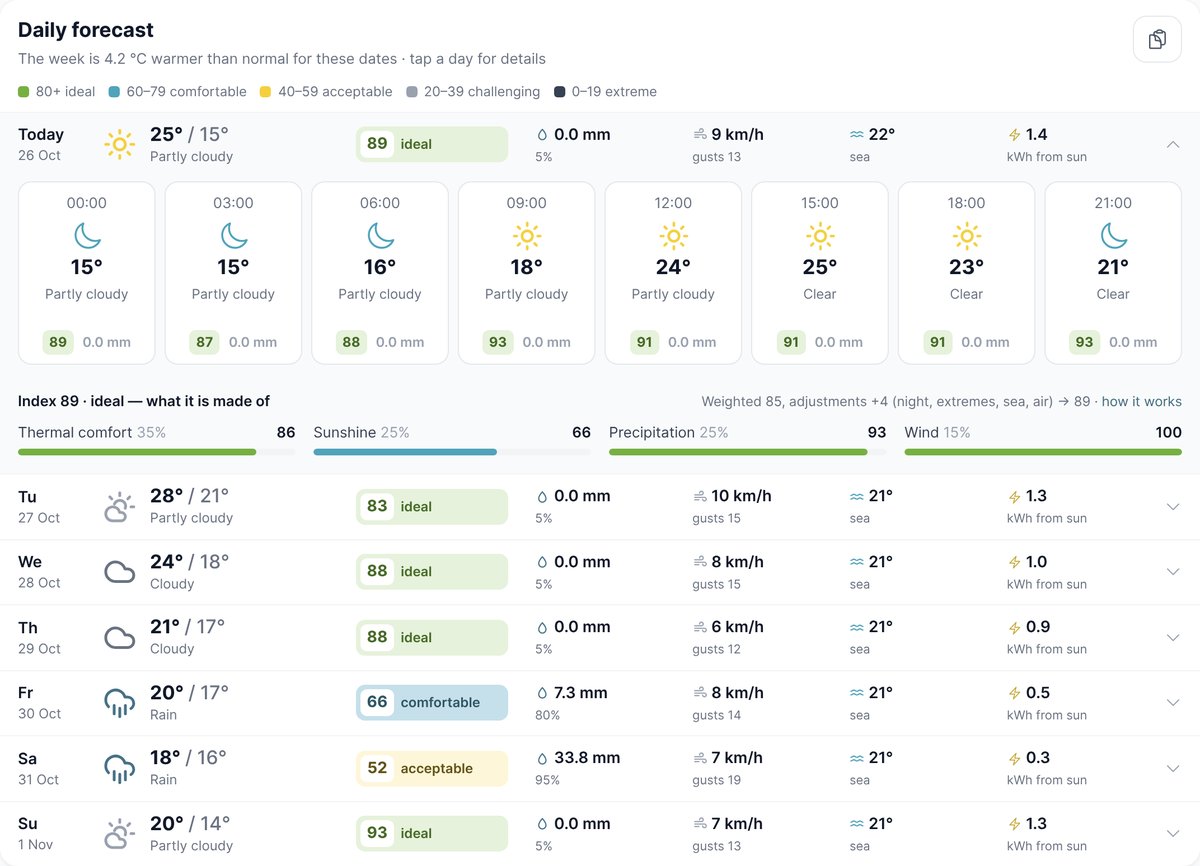
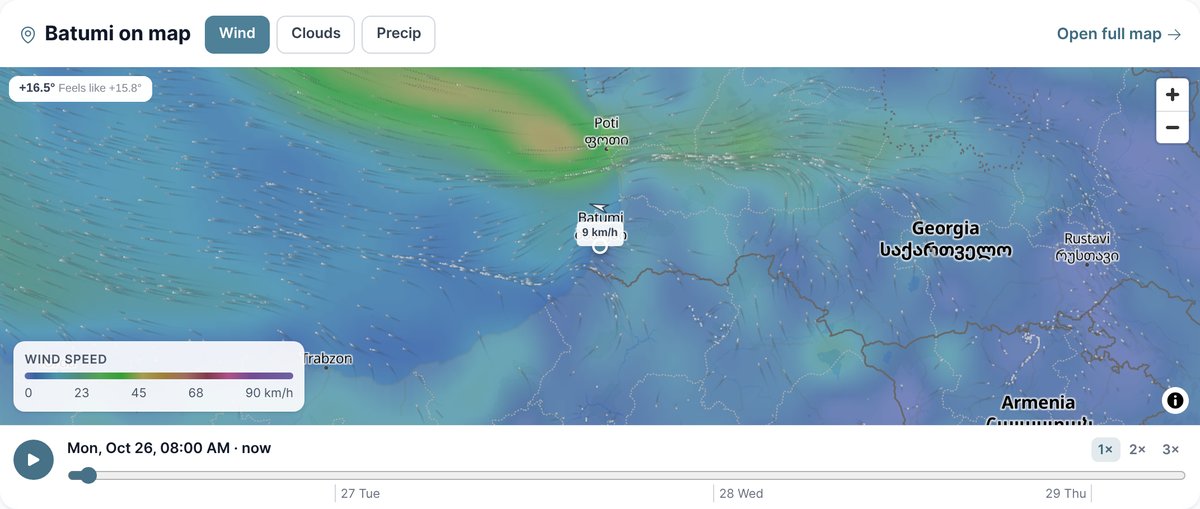
Each day opens into three-hour steps and shows what made up its score. Coastal cities no longer show a generic “Water”. They now say “Black Sea 21°” or “Lac Léman”: 2072 cities on 75 seas and lakes are labelled this way. The map shows wind, cloud and rain for three days ahead, and a slider scrolls through them hour by hour. One button switches the units, and the site remembers where you are and shows your city’s weather straight away in the header.
How the index is calculated now
The index runs from 0 to 100 and shows how well the weather suits travelling and sleeping in a motorhome. That is not the same as “warm”. A day’s score has four parts. Thermal comfort, which takes the dew point into account, makes up 35%. Sun counts for 25%, rain for 25% and wind for 15%. Then come adjustments: a cold or muggy night, a warm or icy sea, dust, smog, pollen. A “feels like” temperature above +32° caps the score. A week is the average of its seven days minus 0.6 times their spread, so a week of “five perfect days and two storms” scores lower than an even one. The OpenVan.camp Editorial team has published the full method, with curves and thresholds, and a separate test recalculates real cities with it and checks the result against the site.
There are more sources now. The forecast comes from our own Open-Meteo server running the DWD ICON model, and for Europe from the detailed ICON-EU with a 7 km grid. Climate comes from the Copernicus ERA5 archive for 2021–2025: the median over five years in a window of ±3 days, which gives 35 days for each date. We chose five years over three after measuring: the error on the least typical day fell from 7° to 4°. Sea and waves come from Open-Meteo Marine, air quality from CAMS.
The same for developers and AI agents
Everything you see on a city page is available through the public API (version 1.9.0): the score and the city’s place in its country, the breakdown of each day, the worst day and the best stretch of the week, and advice as text. New additions are a ranking of cities within a country, a ranking of countries and the method as data, and a separate request returns the climate for any date. The MCP server for Claude and ChatGPT (0.11.0) gained a climate tool, and its answers about a city now match the site. Along the way we found a bug: asking for the best countries in North and South America always returned an empty list. Those regions now work.
What not to expect
A forecast beyond three or four days is still a forecast, and Saturday’s bar may yet change. The ERA5 archive sees the world in 25 km squares: to it, Batumi, Chakvi and Kobuleti are one point, and it smooths a mountain village down to the average height of its square. The archive has no rivers at all, so we show no water temperature for river towns. None of this makes October by the sea any warmer. You just see now whether the rain is normal for the place, and you no longer have to decide blind.